
SOL: Why $100 Support and $120 Resistance Told Different Stories
Analysis date: 14 October 2026
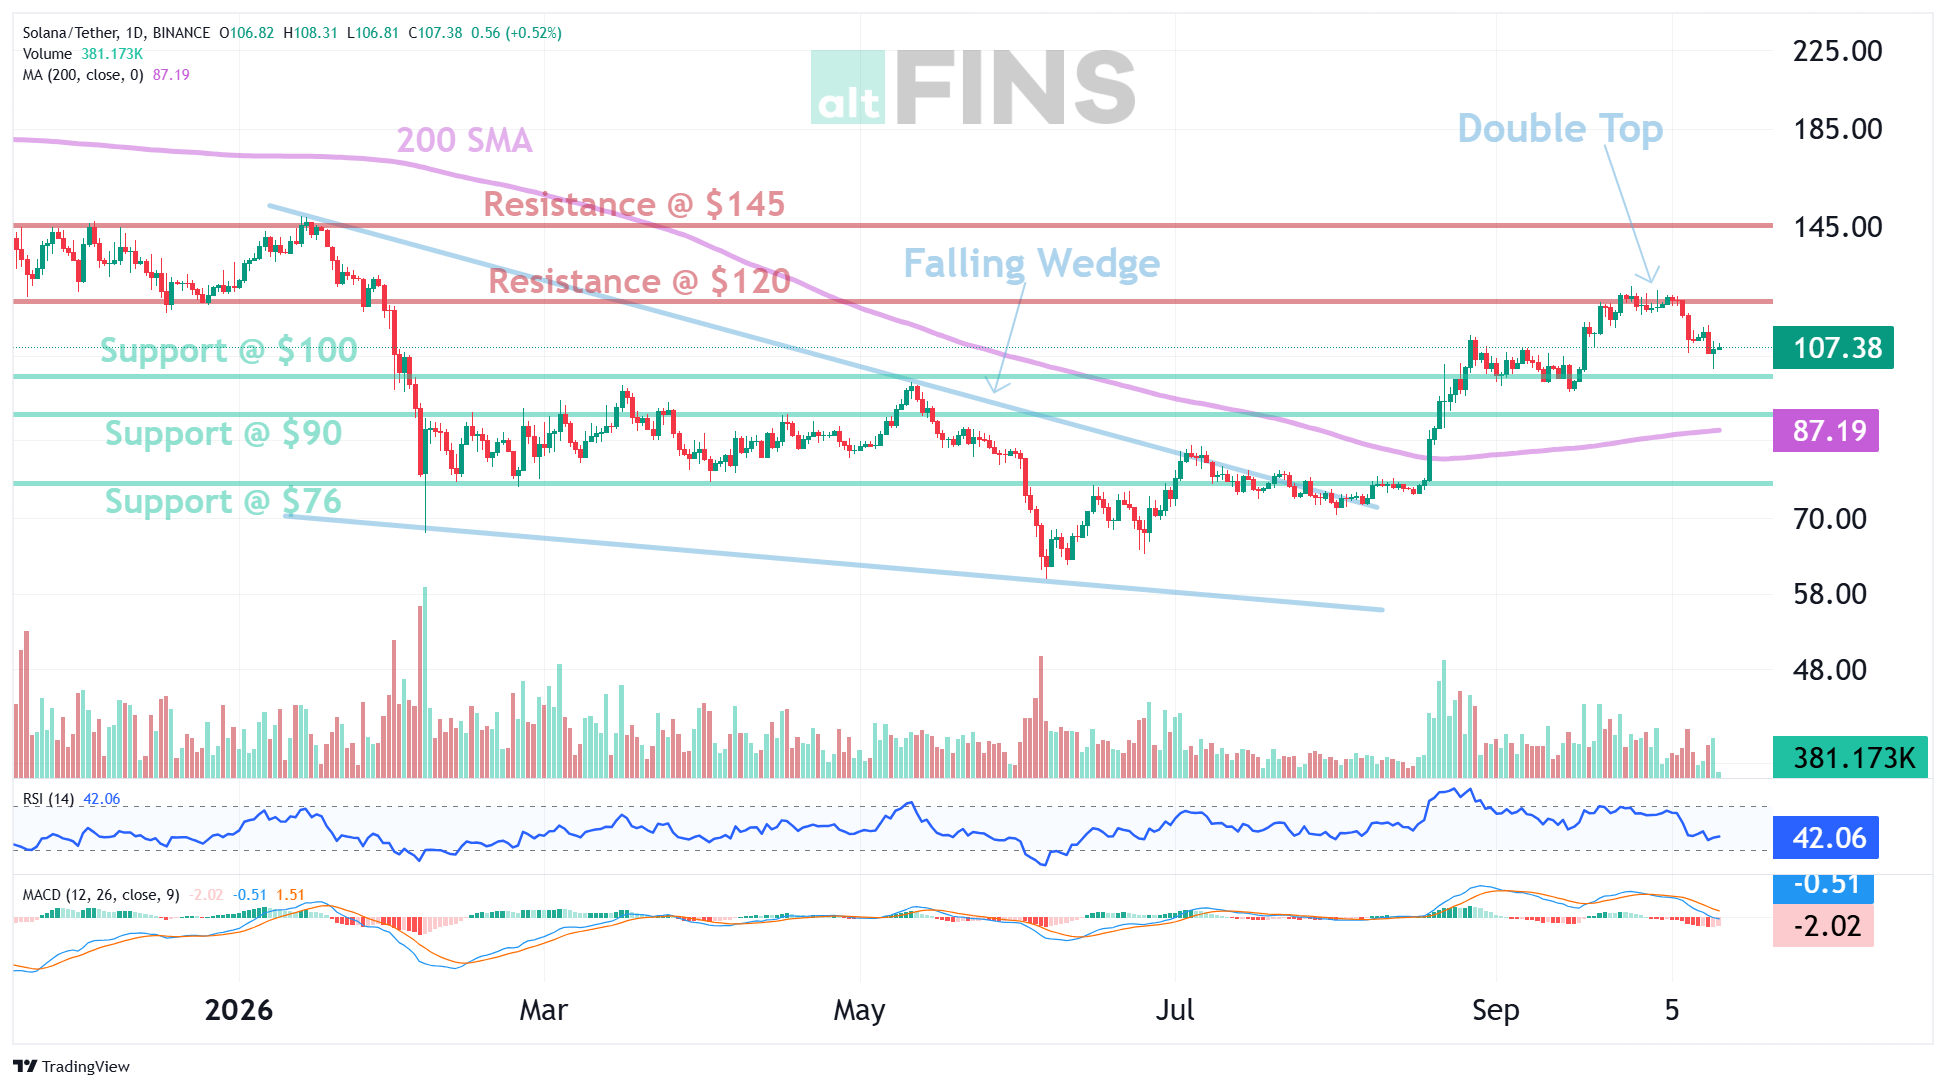
SOL was framed between a support test near $100 and resistance near $120. The $20 gap between those references defined the main swing range for the session map.
Market outlook
The setup separated a short-term pullback from the broader trend. Holding above $100 kept the structure constructive inside the range; losing that floor opened a weaker path toward $90. Clearing $120 would mark a different, conditional upside phase rather than a simple continuation of the pullback story.
Key levels
• Primary support: $100
• Primary resistance: $120
• Lower reference if support fails: $90
Bullish scenario
Stable trade above $100, followed by acceptance through $120, would treat the upper boundary as a breakout rather than a double-top stall and open the next upside extension beyond the prior range.
Bearish scenario
A decisive break of $100 would invalidate the support-hold thesis and shift attention to $90. Repeated failure under $120 without a clean close above it would keep resistance in control inside the range.