
NEAR: What a $5.50 Breakout Needed to Confirm
Analysis date: 16 October 2026
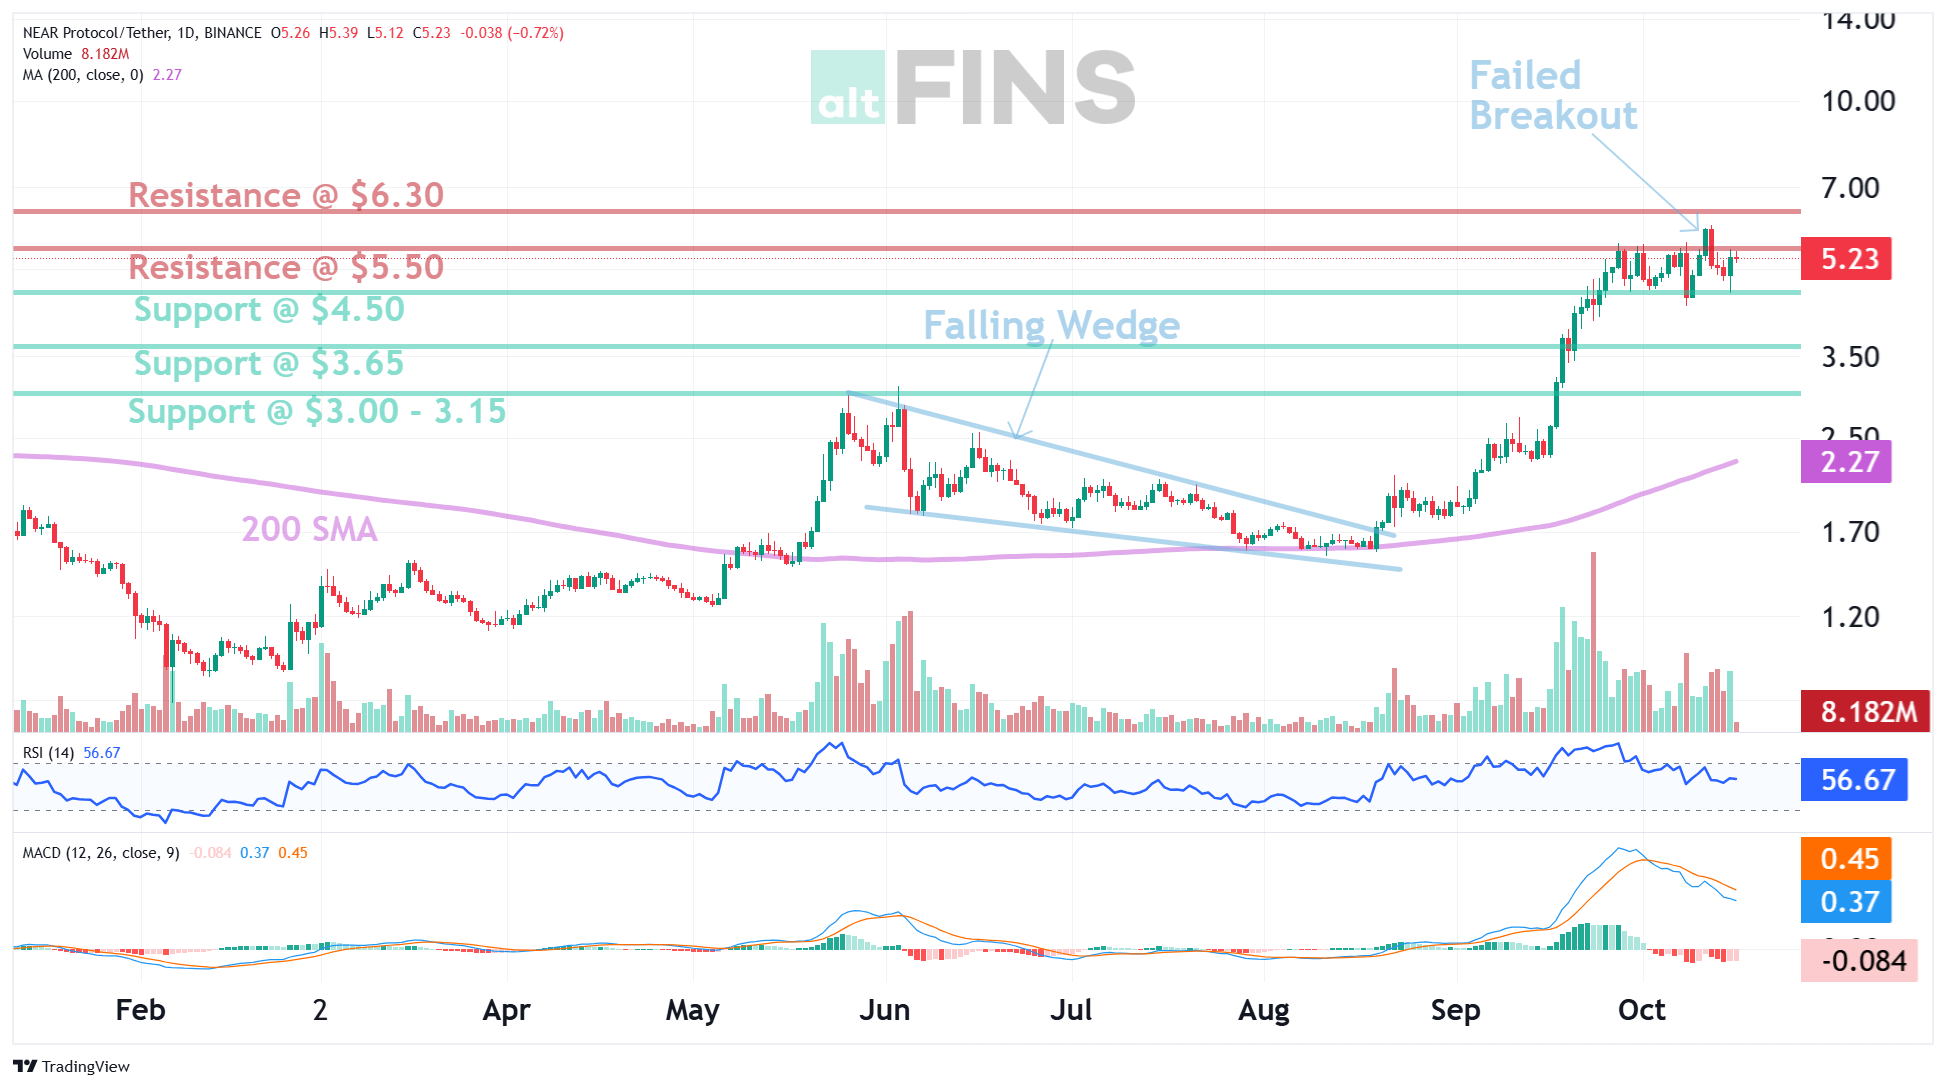
NEAR was testing whether a daily close could clear resistance near $5.50. Above that zone, the map pointed to $6.00 and then $6.30. Below the range, $4.50 remained the key support reference.
Market outlook
Price was pressing a clearly defined resistance band. An intraday spike through $5.50 and a completed daily close above $5.50 are not the same signal: the first shows that orders reached the level; the second shows where the session finished. Until that distinction is settled, the same candle can look like either a breakout or a rejection.
Key levels
• Resistance / breakout trigger: $5.50
• Upside references if confirmed: $6.00, then $6.30
• Downside support if rejected: $4.50
Bullish scenario
A daily close above $5.50 would shift focus to $6.00 as the first destination, with $6.30 as the next conditional extension. Holding above the cleared zone would keep the breakout interpretation intact.
Bearish scenario
Failure to close above $5.50, or a move back below a briefly cleared band, would put $4.50 back in play as the main support reference and treat the upside targets as inactive until the resistance test is rebuilt.