
KAS: When a Rising Channel Stops Acting Like Support
Analysis date: 15 October 2026
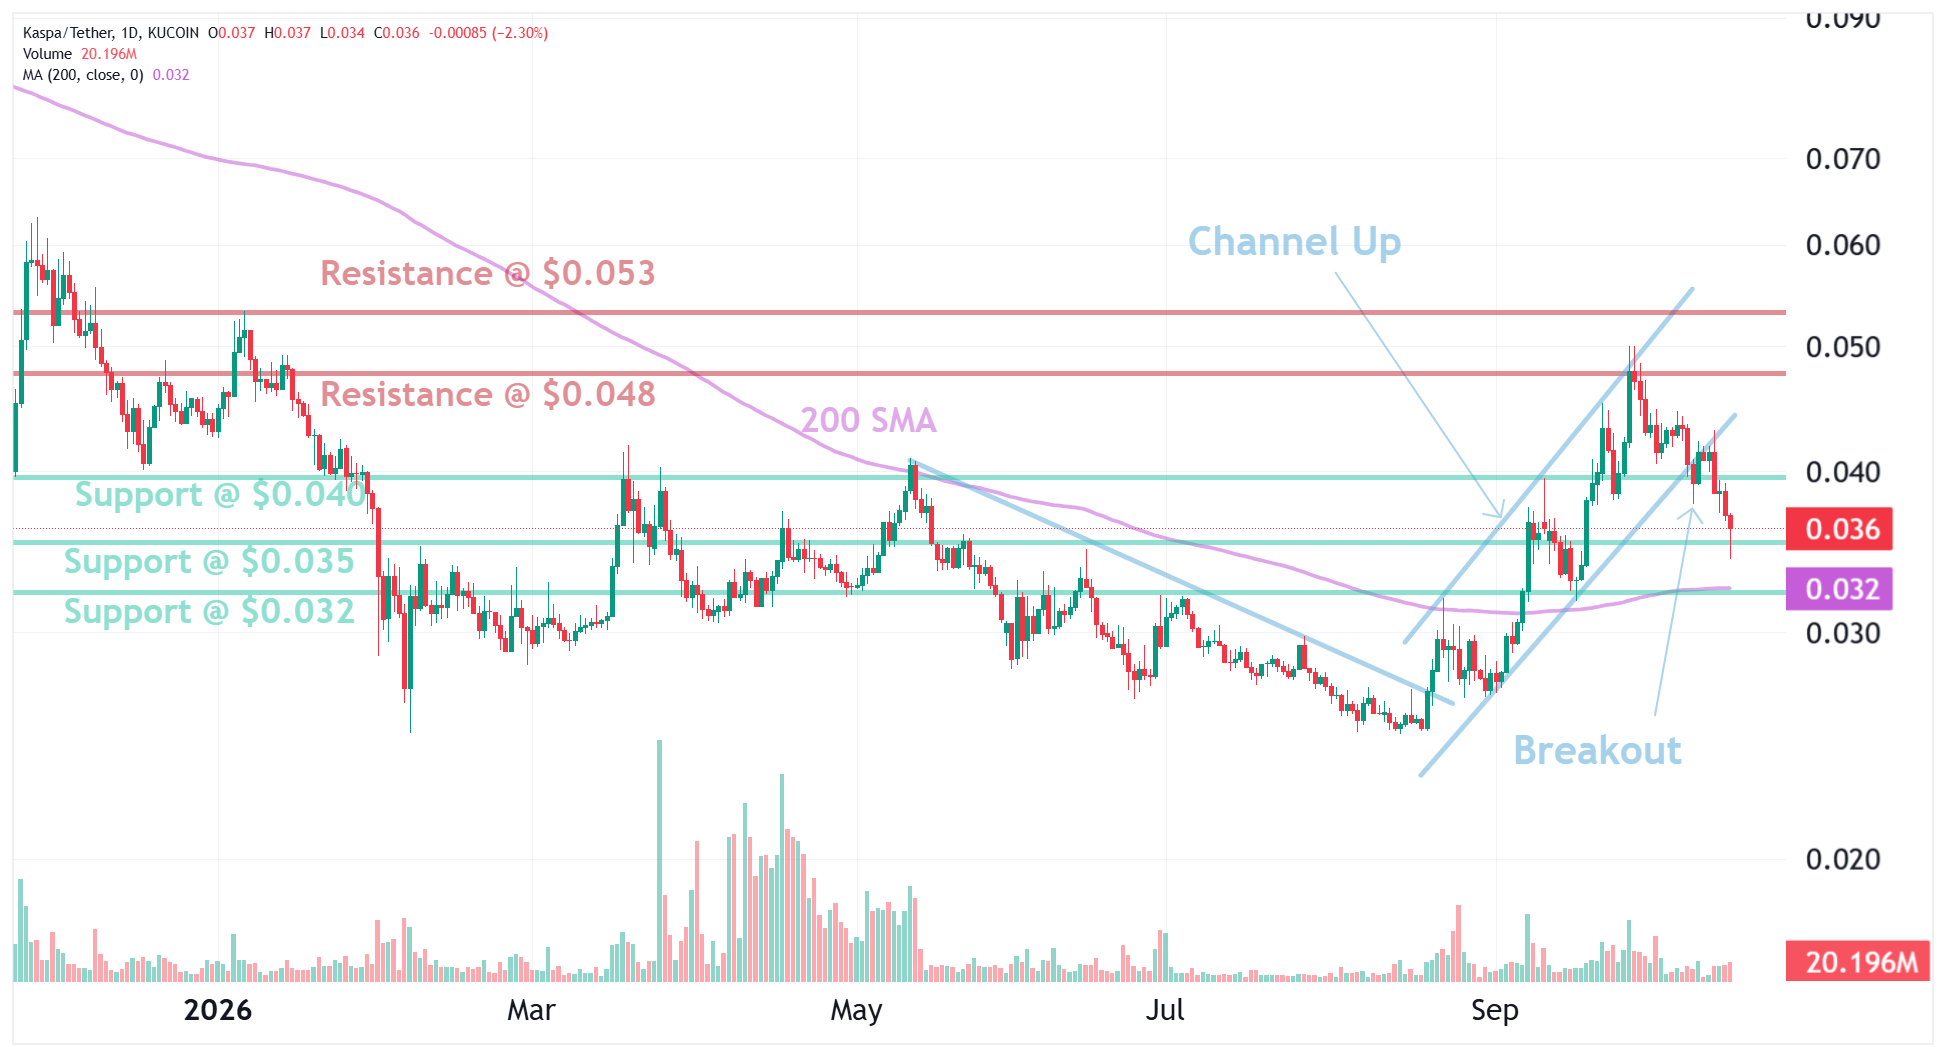
KAS lost the lower boundary of a rising channel and broke horizontal support near $0.40. Rising prices alone had not been enough to keep the structure constructive once those two references failed together.
Market outlook
The useful signal was the combination of a chart boundary and a round-number support print. When both gave way, the prior channel reading stopped describing the market. A reclaim of the broken zone would be required before treating the channel as support again.
Key levels
• Channel support (broken): rising-channel lower bound
• Horizontal support: $0.40
• Reclaim line: back above $0.40 and the former channel edge
Bullish scenario
A decisive reclaim of $0.40 plus the former channel edge would reopen an upside repair path and retire the breakdown reading.
Bearish scenario
Continued trade beneath $0.40 after the channel break would keep the structure weak and treat rallies into the broken shelf as resistance tests.