
FET: Three Support References, One Price Decision
Analysis date: 17 October 2026
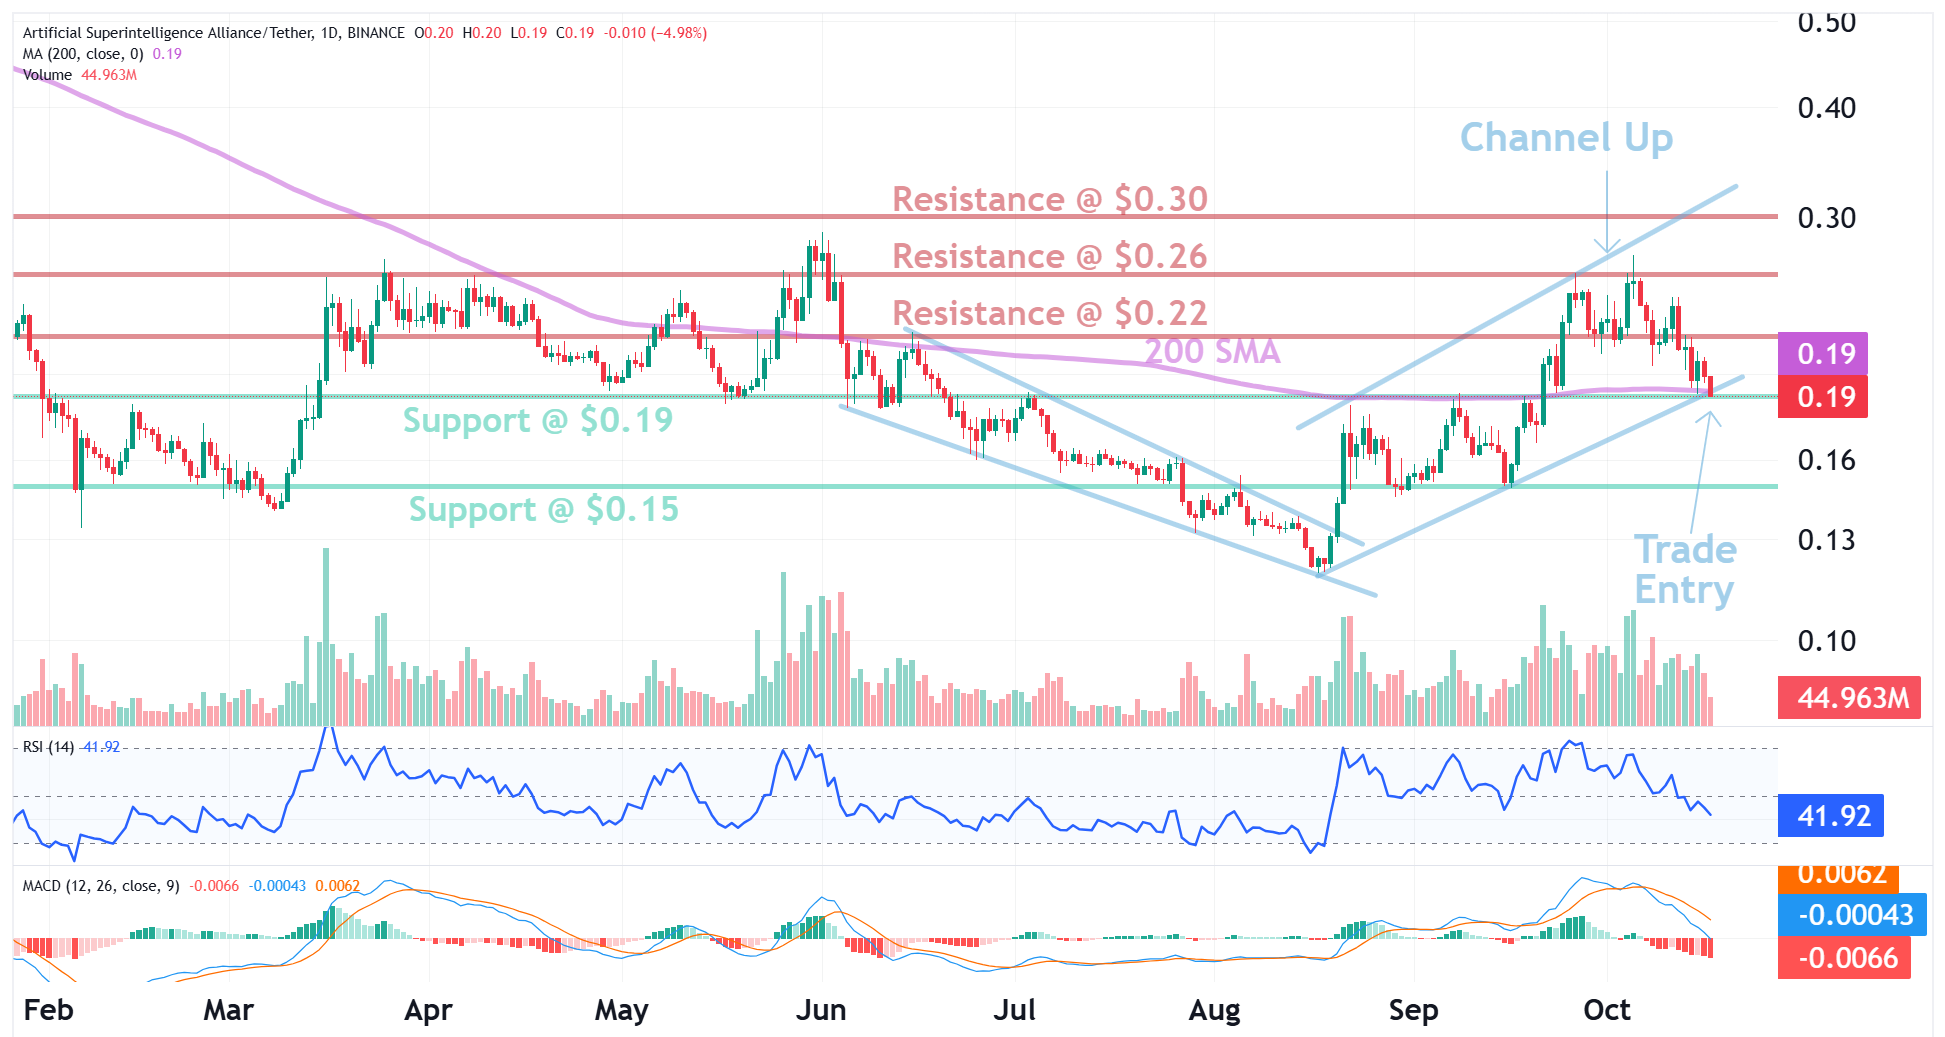
FET was clustered near $0.19, where horizontal support, the 200-day moving average and an upward channel boundary came together. Higher references sat at $0.22 and $0.26.
Market outlook
The decision was not three separate trades—it was one price test at a support confluence. A rebound from that cluster would need to clear the nearer obstacle before the farther target mattered. A sustained break of the cluster would rewrite the map from rebound to further downside.
Key levels
• Support confluence: $0.19
• Near upside reference: $0.22
• Further upside reference: $0.26
Bullish scenario
Holding $0.19 and reclaiming $0.22 would put $0.26 back on the table as the next conditional destination inside a rebound sequence.
Bearish scenario
A daily close through the $0.19 confluence would retire the rebound hierarchy and require a fresh support map before either upper reference is treated as active again.