
BTC: How a Broken $83,000 Reference Changed the Wedge Map
Analysis date: 14 October 2026
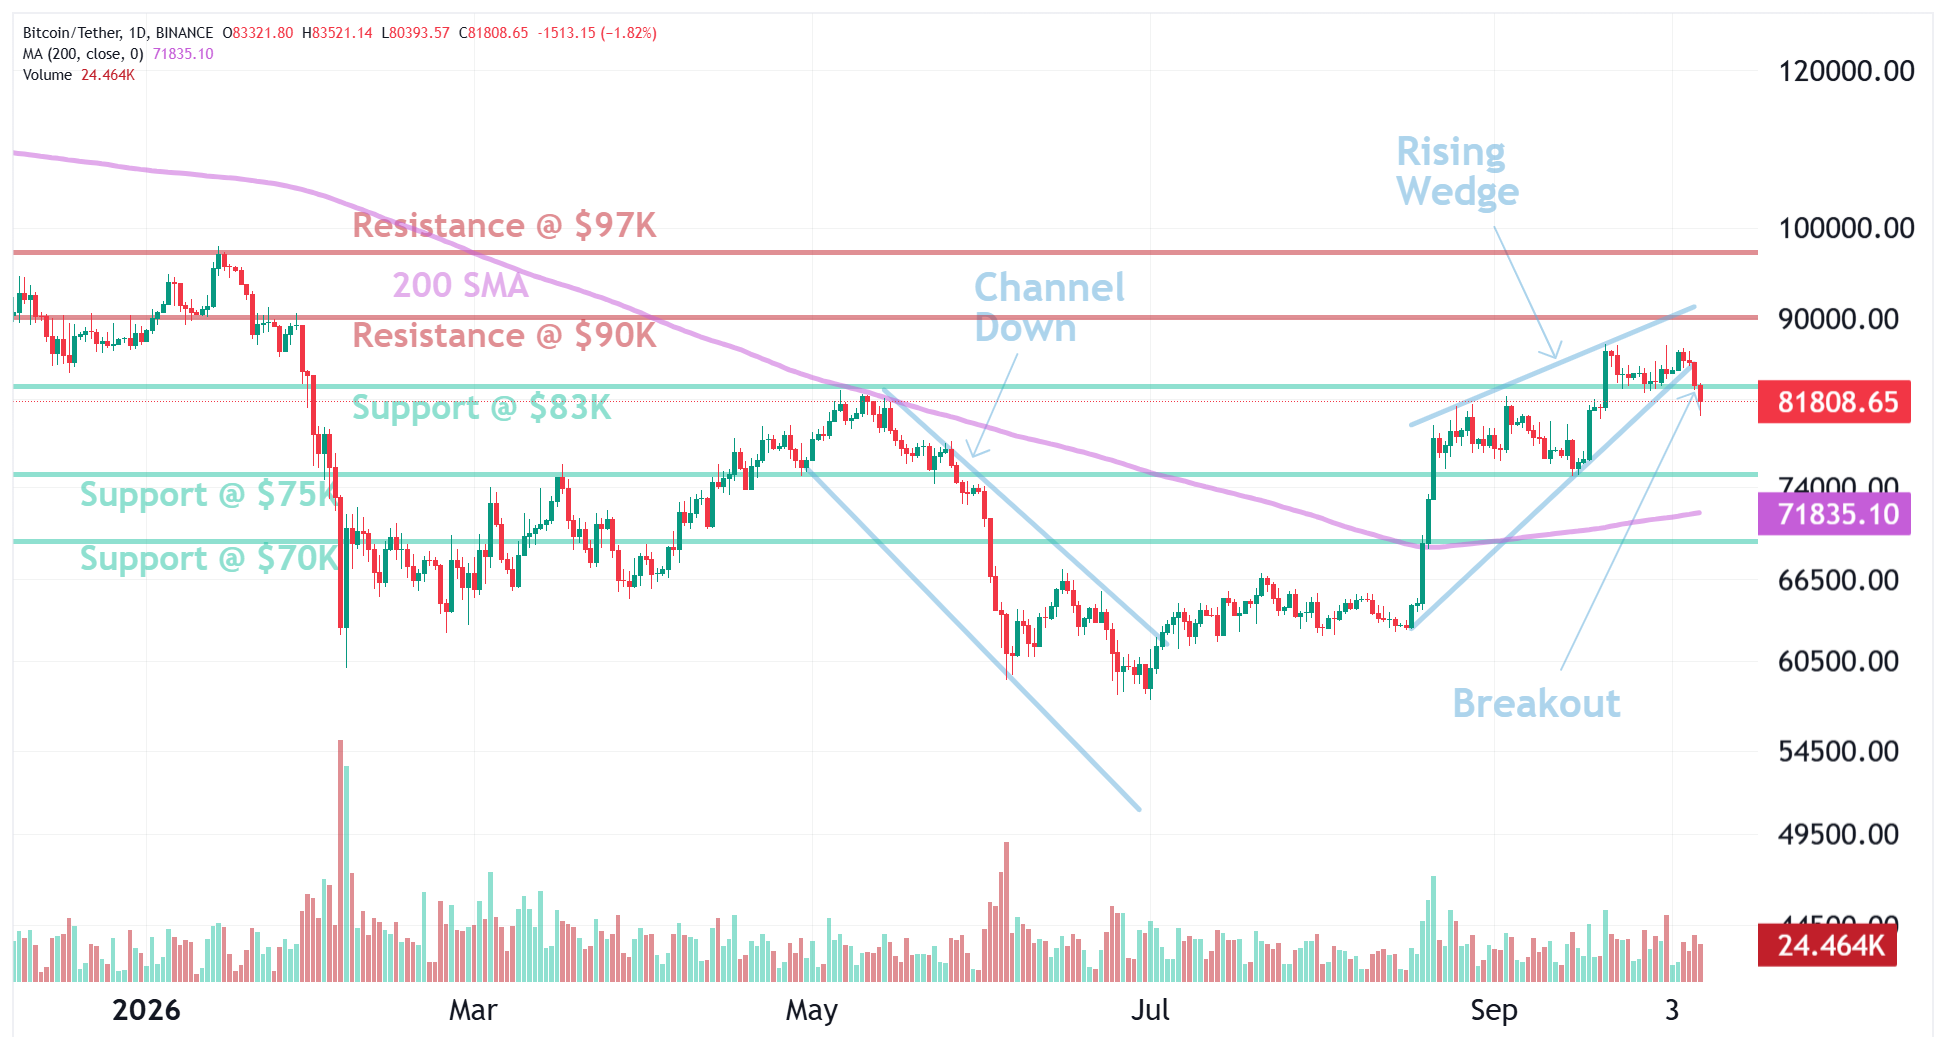
BTC had slipped out of a rising-wedge framework and was trading below an $83,000 reference, with $75,000 discussed as a potential downside destination if the break held.
Market outlook
Losing the wedge support changed the active map from squeeze-higher to repair-lower. The $83,000 print mattered as a hinge: holding back above it would challenge the breakdown; staying under it kept $75,000 as the measured downside focus rather than an automatic print.
Key levels
• Breakdown hinge: $83,000
• Downside reference: $75,000
• Invalidation of breakdown: sustained reclaim above $83,000
Bullish scenario
A sustained reclaim of $83,000 would neutralize the wedge-breakdown path and force a rebuild of resistance above the hinge before any new upside targets are assigned.
Bearish scenario
Acceptance below $83,000 would keep $75,000 as the primary downside reference until price either reaches that zone or reclaims the hinge with conviction.