
BTC and ETH: A Rejection Candle Was a Starting Point, Not a Verdict
Analysis date: 16 October 2026
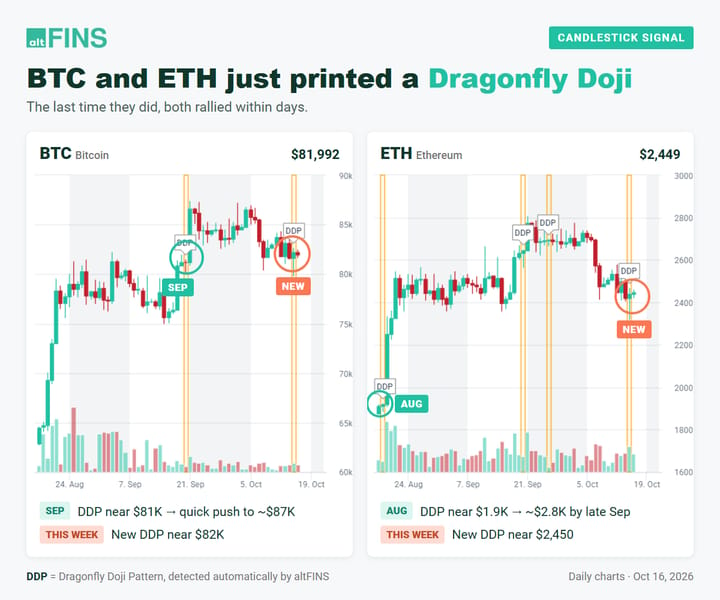
BTC and ETH printed dragonfly-doji style sessions: a deep probe lower, then a recovery back toward the opening area. The open question was confirmation on the next candle, not the pattern name itself.
Market outlook
A rejection wick on one session is a starting point. It becomes useful only when tied to a timeframe, a nearby level and an explicit follow-through rule. The same shape can appear in a continuing decline or near a durable turn—so the next session’s acceptance or failure decides which reading applies.
Key levels
• Signal type: dragonfly-doji / recovery from session lows (BTC and ETH)
• Confirmation: follow-through strength on the next session
• Invalidation: immediate failure back through the session low area
Bullish scenario
Follow-through above the recovery zone on the next session would treat the wick as a rejected selloff and keep short-term upside attempts open on both assets.
Bearish scenario
A quick slip back through the low of the signal candle would treat the pattern as a pause inside weakness, not a completed turn, and keep downside pressure in control.