
Bitcoin and Tech Stocks: Is Your Portfolio Less Diversified Than You Think?
The short answer: Owning Bitcoin alongside technology stocks does not automatically mean that portfolio risk is well spread. Different labels are not enough: position sizes, the direction and size of losses, and the time when money is needed all matter. Test the exposure in dollars before relying on the word “diversified.”
Start with the loss the portfolio could experience
Consider a hypothetical $250,000 portfolio with 60% in an equity sleeve, 10% in Bitcoin exposure, and 30% in cash. This is an arithmetic example, not an allocation recommendation or a forecast.
Assume that the equity sleeve falls 15%, Bitcoin falls 40%, and cash is unchanged over the same hypothetical period. Taxes, fees, interest, trading costs, and rebalancing are excluded.
| Sleeve | Starting amount | Assumed return | Dollar change |
|---|---|---|---|
| Equities | $150,000 | −15% | −$22,500 |
| Bitcoin exposure | $25,000 | −40% | −$10,000 |
| Cash | $75,000 | 0% | $0 |
| Total | $250,000 | −13% | −$32,500 |
Bitcoin represents one tenth of the starting portfolio but contributes about 30.8% of the loss in this particular scenario: $10,000 divided by $32,500. That is a scenario contribution, not a statistical estimate of risk contribution or a probability of loss.
The example does not say that these declines will happen together. It asks whether the resulting loss would be tolerable if they did.
Position size changes the result
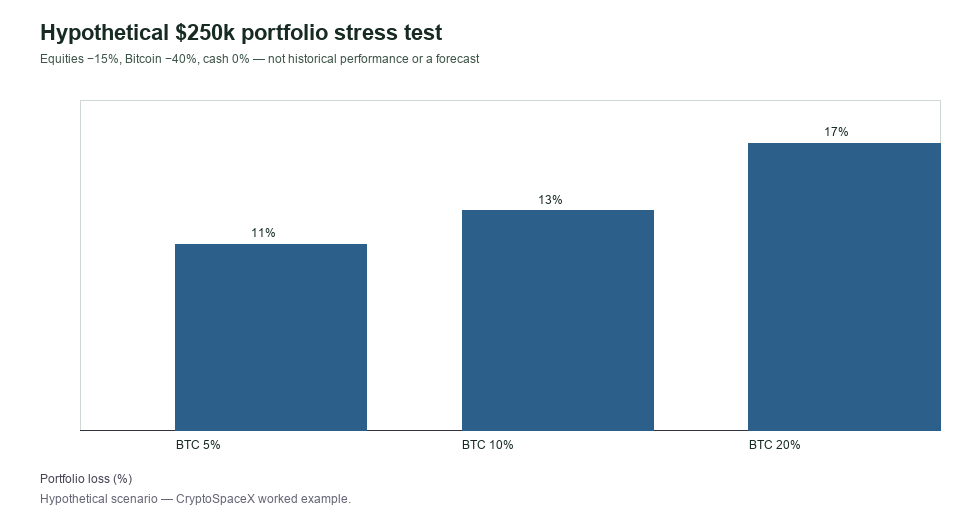
Keep the equity weight at 60%, vary Bitcoin's starting weight, and hold the remainder in cash. Apply the same hypothetical returns to every row:
| Bitcoin starting weight | Equity weight | Cash weight | Portfolio loss | Loss as a share of starting value |
|---|---|---|---|---|
| 5% | 60% | 35% | $27,500 | 11% |
| 10% | 60% | 30% | $32,500 | 13% |
| 20% | 60% | 20% | $42,500 | 17% |
These rows illustrate sensitivity, not an optimal allocation. They also show why a discussion about correlation can miss an immediate practical issue: a position can produce a meaningful portfolio loss even when it is not the largest holding.
Correlation answers a narrower question
Correlation measures how two return series moved together over a chosen sample. It does not guarantee what happens in the next selloff. Fidelity's discussion of Bitcoin in a portfolio treats correlation and diversification as questions that require examining the underlying evidence.
For an investor reading a Bitcoin-versus-Nasdaq chart, five details deserve attention:
- Returns or prices? A correlation between price levels is not the same calculation as a correlation between daily returns.
- Which equity exposure? An index, an ETF, and a concentrated basket of individual technology shares are different portfolios. QQQ can be a disclosed proxy for Nasdaq-100 exposure; it is not the investor's actual holdings or a pure technology-sector portfolio.
- Which clock? A US equity close and a Bitcoin calendar-day close can refer to different moments. Align timestamps before presenting a daily comparison.
- Which sample? A 30-observation result and a 90-observation result answer questions about different windows. Report the dates and the observation count.
- What happened during losses? A full-period average can obscure the experience during a small number of stressful sessions.
Do not assume Bitcoin behaves like gold because both are described as alternatives. The portfolio question is empirical and depends on the assets, weights, and period being examined.
Three forms of overlap to examine
Economic exposure. Ask whether several holdings depend on similar conditions, such as investors' willingness to take risk. That is a hypothesis to test against data, not proof that they will always move together.
Implementation exposure. An investor may own Bitcoin directly, a Bitcoin fund, and shares of a company with substantial Bitcoin exposure. Three account entries can still represent overlapping exposure to the same underlying asset. Company shares also introduce business and financing risks of their own.
Liquidity needs. A portfolio loss matters differently when funds are required soon. Separate money committed to near-term expenses from a discussion about long-term asset performance. A projected recovery is not a source of cash on a fixed date.
A practical review before changing anything
Write down the current dollar exposure, including funds and indirect holdings. Choose several clearly labeled scenarios rather than one convenient outcome. Calculate each sleeve's dollar change, add them, and compare the total with the spending or funding needs the portfolio must support.
Then check the evidence behind the scenario. If you use a historical comparison, specify the instruments, return convention, time alignment, and start and end dates. If the figures are hypothetical, keep that label next to the table and chart.
The useful question is not simply “Do Bitcoin and stocks correlate?” It is “What combination of losses could my portfolio experience, and have I measured that exposure honestly?”
Continue the analysis
Join the CryptoSpaceX community to discuss market evidence, compare assumptions, and follow chart-based crypto updates. This article's stress test is available in the public table above; joining is optional.
Join the CryptoSpaceX Telegram channel · Open the CryptoSpaceX bot
The calculations are educational scenarios, not personalized asset-allocation advice. Historical relationships and hypothetical stress tests do not establish future outcomes.
Discuss the evidence with the CryptoSpaceX community and follow chart-based crypto updates. Read the analysis here, then join the conversation if it is useful to you.
Assessment
Use a transparent portfolio stress test to examine Bitcoin and tech-stock exposure, understand correlation limits, and identify overlapping risks.
Conditions and risks
Conditions and risks: The $250,000 stress test is hypothetical, not historical performance or a forecast; equity and Bitcoin returns are assumed independently for illustration; taxes, fees and rebalancing are excluded; correlation is not estimated in this guide.