
Bitcoin ETF Outflows: When Should Long-Term Investors Worry?
The short answer: A day of Bitcoin ETF outflows is a reason to examine demand, not a stand-alone instruction to sell. Start with a completed reporting period, distinguish withdrawals from slower inflows, and compare the pattern with price behavior. The headline becomes more useful when you can explain what changed and what would change your assessment.
Start with the number the headline is actually describing
Four figures are often mixed together in discussions of Bitcoin ETFs:
| Figure | The question it answers | The conclusion it cannot establish by itself |
|---|---|---|
| Net fund flow | Was reported creation activity greater or smaller than redemption activity? | Whether every institution is buying or selling Bitcoin |
| Share trading volume | How much of the ETF changed hands in the secondary market? | How much new money entered the fund |
| Assets under management | What was the fund's reported asset value at a particular time? | How much of the change came from investor flows rather than valuation |
| Bitcoin price | What price did the selected market report at the selected time? | Which group of investors caused the move |
An investor selling ETF shares to another investor generates a trade. That trade is not automatically a fund redemption. Likewise, a falling asset value does not, on its own, demonstrate withdrawals: valuation changes can also affect the total. These distinctions matter before any attempt to interpret a money-flow headline.
A slower inflow is not an outflow
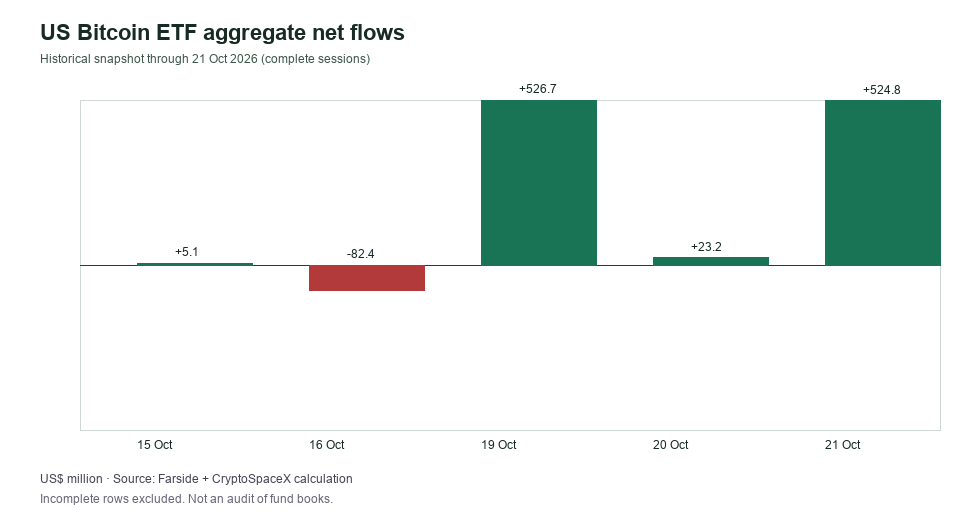
Here is a dated example from Farside Investors' US Bitcoin ETF flow table. The figures are aggregate net flows in US$ millions, not ETF trading volume. This is a historical five-session snapshot through 21 October 2026, not a statement about the current trading session.
| US trading date | Aggregate net flow, US$ million | Sign |
|---|---|---|
| 15 October 2026 | +5.1 | Net inflow |
| 16 October 2026 | −82.4 | Net outflow |
| 19 October 2026 | +526.7 | Net inflow |
| 20 October 2026 | +23.2 | Net inflow |
| 21 October 2026 | +524.8 | Net inflow |
Across these five sessions, the reported net total was +$997.4 million. The move from +$526.7 million to +$23.2 million was approximately a 95.6% decline in the size of the daily inflow. It was not a 95.6% withdrawal from the funds, and the smaller number remained positive. The following session also reported a positive flow.
The source displayed incomplete constituent entries for 22 October when this snapshot was checked. An incomplete row is excluded here rather than treated as a confirmed zero-flow day. Figures may subsequently be revised.
Three checks that make the signal more useful
1. Persistence. Put the latest completed day alongside the last five and twenty completed trading sessions, when that history is available. A large negative day within a positive period tells a different story from repeated withdrawals. Do not switch between calendar days and trading sessions without saying so.
2. Breadth. Check whether a change is concentrated in one fund or appears across several products. A movement between products can alter individual fund totals without producing the same change in aggregate Bitcoin ETF demand. The table alone cannot identify an investor's motive.
3. Price response. Compare the flow window with an explicitly timed price series. If price holds up during withdrawals, that raises a question about other demand; it does not prove who supplied it. If price weakens despite inflows, other selling or positioning may matter. Neither observation establishes causation.
A review framework for an existing holding
This is a checklist for evaluating evidence, not a validated trading system:
| Observation | Useful follow-up | What would be premature |
|---|---|---|
| One negative day; the wider period remains positive | Check later completed sessions and any source revisions | Concluding that institutions have abandoned Bitcoin |
| Several negative sessions across multiple products | Review the size and persistence of the change alongside price and portfolio exposure | Treating a fixed number of outflow days as a guaranteed sell signal |
| Withdrawals coincide with a sustained price decline | Examine whether the original holding thesis and loss tolerance still fit | Assuming ETF flows explain the whole decline |
| Positive flows return but price remains weak | Look for competing evidence and avoid declaring a recovery too early | Calling positive flow a price floor |
The practical decision is larger than the flow table. Why do you hold the exposure? What loss could the overall portfolio absorb? Is money needed on a timetable that a volatile asset may not accommodate? Those questions do not disappear when a daily flow number turns positive.
What to watch next
- The next fully reported session, rather than a partially populated row.
- The five-session net total and whether withdrawals broaden across funds.
- Whether price behavior supports or challenges the interpretation, using a stated venue and cutoff.
For a long-term holding: Use flows to challenge a thesis, not replace one. A clear assessment states the reporting window, shows the arithmetic, and identifies evidence that would make the assessment change.
Keep the discussion tied to the evidence
Discuss the evidence with the CryptoSpaceX community and follow chart-based crypto updates. Read the analysis here, then join the conversation if it is useful to you.
This article provides general market education. It does not assess an individual investor's circumstances or promise an investment outcome.
Assessment
Learn how to read Bitcoin ETF outflows, distinguish weaker inflows from withdrawals, and assess the evidence before changing a long-term position.
Conditions and risks
Conditions and risks: ETF flow figures can be revised; incomplete constituent rows are not treated as zero; a single outflow day does not establish a sell instruction; price moves have multiple causes beyond ETF creations and redemptions.